

7 things you won't know: What are Chatbots and Why do you need it?
What are chatbots?Chatbot or a ‘chatter robot’ self-explains its mechanism of interaction using some super advanced technology via a chat interface....
4 min read
In general terms, Clustering can be termed as the process of breaking down a large population or data-set into smaller groups. As an analyst, you will often face this question where you need to organize the data that you are observing into a meaningful structure or pattern. This is where clustering comes in handy.
Clustering is a method of unsupervised learning. It is a common technique for statistical data analysis used in many fields. This method draws references from datasets as a part of input data without labeled responses.
But, what exactly is machine learning? Well, there is no universal definition, but at a high level, Machine learning is defined as the semi-automated extraction of knowledge from data. Let’s break that down into three component parts:
Basically, Clustering in ML allows you to break a population into smaller groups where each observation within every group is more similar to each other than it is to an observation of another group. So, the idea is to group together similar kind of observations into smaller groups and thus break down the large heterogeneous population into smaller homogenous groups.
Let’s take an example to understand how clustering works exactly. Imagine that you own a chain of ice cream shops. Suppose you have a number of ice cream shops across the country. Say, you have 8 of them and you sell two flavors of ice creams (strawberry and chocolate).
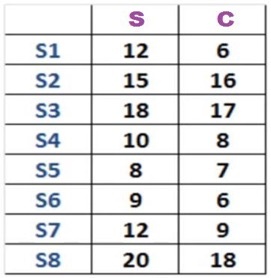
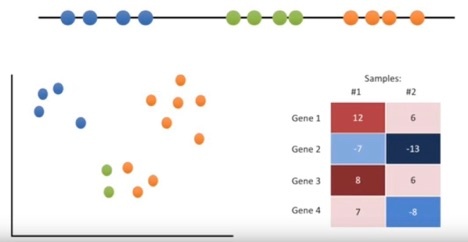
Now in this table, you see the sales of both strawberry and chocolate ice cream across your eight sources. In order to get a better sense of this data, you can plot this data on a graph. So, here we have plotted the sales of both strawberry and chocolate. There are eight dots in this graph that represents a store. Moreover, on the Y-axis you have your strawberry sales and on the X- axis you have chocolate.
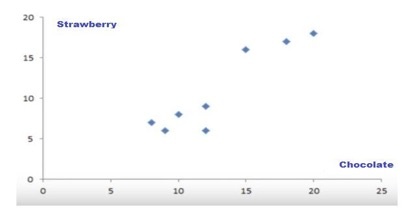
This is a very intuitive way of looking at this data to understand what this actually means. After the analysis of this data, you will have a very clear insight on dividing your stores into two distinct groups. In this way, your eight stores can be divided into two different groups that behave slightly different in terms of their strawberry and chocolate sales. So, essentially, this how clustering works.
Hierarchical clustering: This technique includes the process of forming clusters that have a definite ordering from top to bottom. For instance, all books are arranged in bookshelves, are organized in a hierarchy or alphabetical order. Furthermore, there are two types of hierarchical clustering, Divisive and Agglomerative
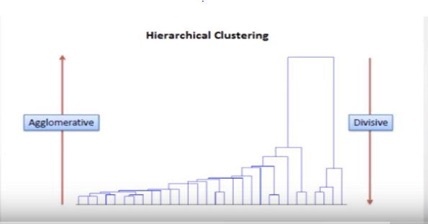
If we look at this diagram, we can see that the divisive clustering goes from top to bottom. Basically, we start big and then break things into smaller pieces. On the other hand, in agglomerative clustering, we start small pieces and then we go all the way up by matching things until we have big components.
K- means clustering: This one of the most popular techniques and easy algorithm in machine learning. Let’s take a look on how to cluster samples that can be put on a line, on an X-Y graph, and on a heat map. Imagine you had some data that you could plot on a line, and you knew you needed to put it into three clusters. Maybe they are measurements from three different types of tumors or other cell types. In this case, the data make three relatively obvious clusters. But, rather than rely on our eye, let’s see if we can get a computer to identify the same 3 clusters. To do this, we will use the K-means clustering.
We will start with raw data that we haven’t yet clustered.
Step 1: Select the number of clusters you want to identify in your data. This is the "K" in K-means clustering. In case, we will select K=3. That is to say, we want to identify 3 clusters.
Step 2: Randomly select 3 distinct data points.
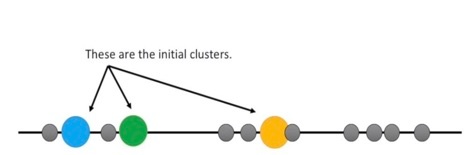
Step 3: Measure the distance between the first point and the three initial clusters.
Step 4: Assign the first point to the nearest cluster. In case, the nearest cluster is the blue cluster. Thus, we will continue the same process for the next points. Once all the points are in clusters, we will move on to the next step.
Step 5: Calculate the mean of the cluster. Then again, measure and cluster using the mean values. If the clustering did not change at all during the last iterations, we are done.
Basically, the K-means clustering is pretty terrible compared to what we did by eye. We can assess the quality of the clustering by adding up the variation within each cluster. Since, K- means clustering cannot see the best clustering; its only option is to keep track of these clusters and their total variation and do the whole thing over again with different starting points.

What are chatbots?Chatbot or a ‘chatter robot’ self-explains its mechanism of interaction using some super advanced technology via a chat interface....
A lot of people do not know the term Intent Analysis but I’m sure that they must have heard about it. This term is really important for a business...
Business today are struggling to keep pace with the rapidly evolving technology, voluminous data, customer demands, process inefficiencies and a lot...